

25 Jan How to Review your 2017 Website Analytics: The Basics
We are almost to the end of January and 2018 marketing plans should be ready. But, did you include or take into consideration your website analytics data from 2017? If not, you are missing out on some very important and juicy information. Now I know most of us do not enjoy combing through data while trying to make sense of numbers and graphs. I am here to tell you that it is not as scary as it looks and to walk you through the basic reports to review.
Assuming that you already have a Google Analytics account for your company’s website and know how to login, let’s get started. If not, stop right here and contact us.
When you are looking at your beautiful (perhaps terrifying) Google Analytics dashboard, the three basic areas you want to review are AUDIENCE, ACQUISITION, and BEHAVIOR in your left column side bar.
Audience. Click on your AUDIENCE tab then directly underneath click Overview. Before you start looking over your data, change the date range of your data to show all of 2017. In the top right corner of your overview report there is a set of dates. Click on the little arrow and change the date range to Jan 1, 2017 – Jan 1, 2018. Hit “Apply” and now you have all your data for 2017.
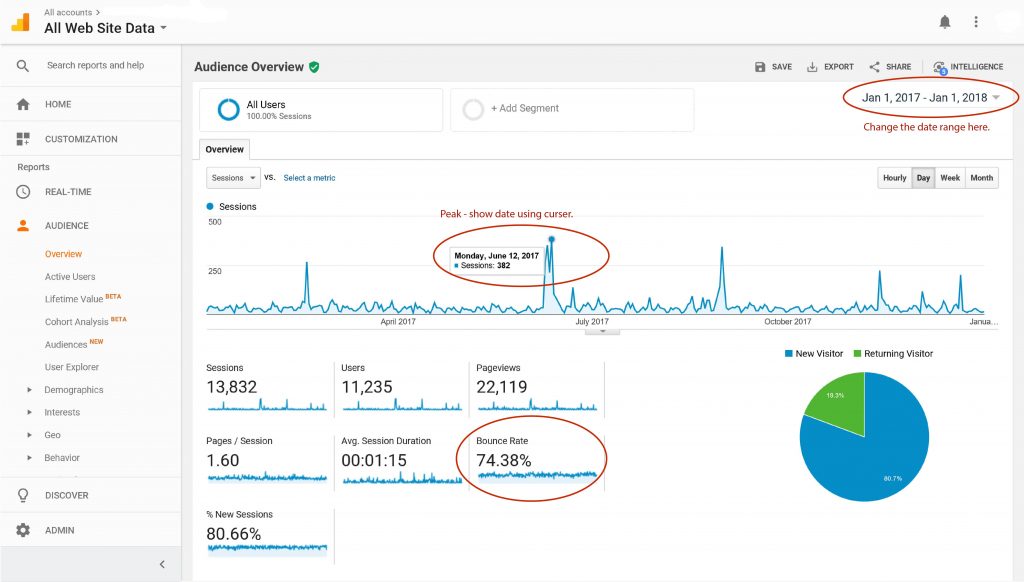
The first thing to look at is the top “Sessions” graph. Sessions are a period of time when a user is active on your website. This graph shows the number of sessions for every day in 2017. If you have big peaks, put your curser at the top of the peak and review the date. Ask yourself what was going on with my business this day? Did you have an event? What did you post on social media? Find out what caused those peaks in website traffic and make sure you keep those in your marketing strategy.
Next, look at your Bounce Rate. Your Bounce Rate is the percentage of single-page sessions in which there was no interaction with the page. Meaning someone landed on one of your pages and then left without going to any other pages. A high bounce rate means visitors are either landing on your website and not happy with the content (for a variety of reasons) or they landed on one page, looked at the content, and then left your website.
Bounce Rates:
26 to 40 percent = excellent
41 to 55 percent = average
56 to 70 percent = higher than average
Over 70 percent = concerning/needs further research
While you are still looking at your Overview report, scroll down under all the graphs to click on “City” under your Demographics section. This page shows the top 10 cities where your website visitors are located. Pretty cool huh? Also under your AUDIENCE tab, click on Demographics then Overview to see the age and gender of your website users.
Acquisition. Next, click on the ACQUISITION tab then underneath click Overview. Review the colorful graphic with your top channels. Here you can see how people get to your website.
- Organic Search means people finding your website through search engines such as Google.
- Social means people coming to your website from social media networks such as Facebook.
- Referral is people who come to your website from another website by clicking on a link.
- Direct traffic is most often the result of a person entering a URL into their browser or using a bookmark to directly access the site. It can also be from clicking a link in an email or document.
- Other is a little more complicated, but basically it involves custom campaign tracking. Unless you set this up and are using UTM parameters, you will not see a percentage or any sessions.
What has the biggest piece of the pie or highest percent? If it’s Organic Search, then your SEO strategy must be working well. If you have a high Social percentage, then your social media strategy must rock! The one thing I want you to do on this page is click on Social, which will take you to a Channels page and show you what social networks are sending people to your website.
Behavior. The last basic element you should review is under the BEHAVIOR tab. Click Site Content, which will drop down more options, and click All Pages. This report will show you the top 10 pages that are viewed the most on your website. This data is good to know for your marketing plan.
The other report I would recommend checking out and also under Site Content is Landing Pages. Your Landing Page data shows the top pages that are seen first when someone visits your site. These are the pages they land on first before navigating to any other pages on your website.
We’d love to answer any questions you may have on this subject and guide your organization. Did you know we offer educational and training sessions in addition to our tailored one-on-one services (all real live people here…no bots). Call 757-777-3780, or email info@germono.com – let’s set up a complimentary 30 minute consultation to learn more about your needs.